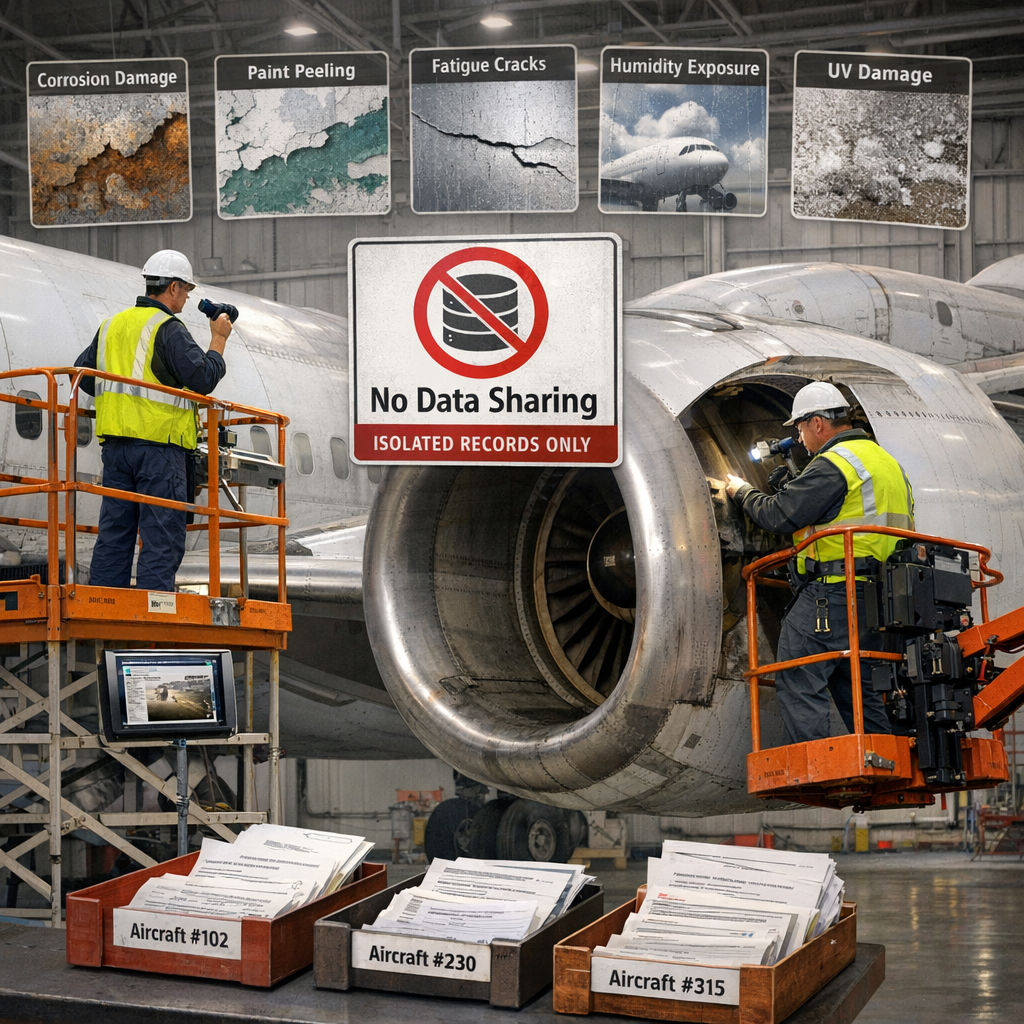
A drone surveys every surface for paint damage, dents, and other defects. Planespect logs each finding across the fleet, predicts deterioration, and directs inspectors to the right spot at the right time.
Certified inspectors still climb scaffolds and cherry pickers to examine fuselage panels, wings, and nacelles. Each inspection starts from scratch: no spatial record, no fleet-wide learning.
Patterns that span hundreds of aircraft—zone-specific wear, climate-linked paint breakdown—stay hidden because data never leaves individual maintenance files.
Manual inspection burns hangar hours, varies by inspector, and obscures fleet-level trends.

Each layer adds value the previous one cannot deliver by itself.
An autonomous drone records complete surface imagery inside the hangar. Routes generated from OEM CAD geometry guarantee identical coverage on every visit.
Built-in quality gates flag blur or gaps, triggering automatic recapture. Controlled lighting tames glare on painted aluminum.

Each scan extends a persistent surface record. Software aligns structural zones, tracks change, and predicts how every defect will evolve—before the next check.
A 3D digital twin fuses imagery, OEM data, and inspection history into a living model for every tail. Fleet-wide baselines then estimate when any defect will hit its allowable limit.
The system outputs priority-ranked worklists driven by structural context and predicted growth. For example, a fast-growing paint flaw near a fatigue-critical splice tops the list, while a stable scuff on a fairing can wait.
OEM references and fleet-wide models make that triage computable. Each flagged zone arrives with a recommended action and a forecast intervention date.

Most drone inspection tools only show that something looks wrong. Planespect links each defect to real structure, maintenance history, and engineering data—so inspectors know what matters, what can wait, and what is getting worse.
| Typical Drone Inspection | Planespect | |
|---|---|---|
| What it finds | Visible marks or damage in photos | Visible defects tied to the actual aircraft structure |
| What the location means | A spot on an image | An exact aircraft zone with known structural importance |
| How priority is set | Visual severity: How bad it looks | How bad it looks and how important that area is |
| What history shows | Separate inspection snapshots | Time-based records showing whether damage is stable, spreading, or accelerating |
| What happens next | Operators decide when to re-inspect | The system forecasts when a finding is likely to reach allowable limits |
| How results are explained | A confidence score from software | Measured findings with structural context for inspector review |
| What operators learn over time | Issues on one aircraft at a time | Fleet-wide patterns, including repeat problem areas and degradation trends |
Surface intelligence that pinpoints what’s wrong, where it matters, and when you’ll need to act.
Get in Touch